k8spacket
What is k8spacket?
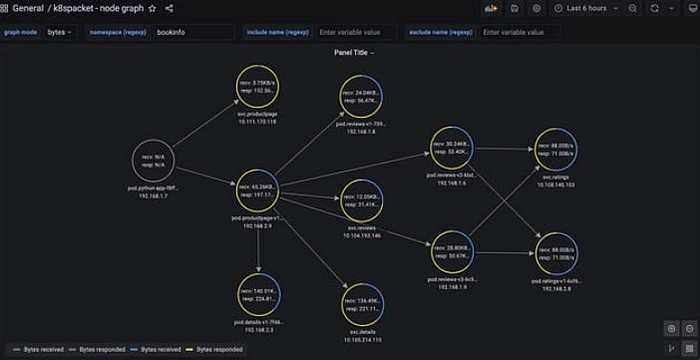
k8spacket is a tool which allows you to visualize the TCP traffic in your K8s cluster, and let you understand better how different workloads communicate with each other. Use k8spackt and Grafana , you can easily check how many connections that were open, how many bytes were exchanged, and how long those connections were active.
A quick example looks like the following:
Pic from k8spacket
k8spacket is written in Golang that uses third-party libraries (gopacket) to sniff TCP packets (incoming and outgoing) on workloads, and it creates TCP listeners on running container network interfaces.
When a new container is created, the CNI plugin is responsible for providing the possibility to communicate with other containers or from the cluster to the outside world.
The most common approach is to use Linux namespaces to isolate networks, and veth pairs to connect isolated namespaces and bridges. However other types can also be created, such as vlan, ipvlan and macvlan . No matter with type, a network interface for the container linux namespace is created, which is the main handle of the k8spacket sniffer.
k8spacket Features
k8spacket helps to understand TCP packets traffic in your k8s cluster and has the following features:
- Shows traffic between workloads in the cluster
- Informs where the traffic is routed outside the cluster
- Displays information about closing sockets by connections
- Shows how many bytes are sent/received by workloads
- Calculates how long the connections are established
Pic from k8spacket
k8spacket Installation
k8spacket can be installed using Helm , the Chart is available at: https://github.com/k8spacket/k8spacket-helm-chart
Once you have Helm installed, you can add the repo as follows:
shell
$ helm repo add k8spacket https://k8spacket.github.io/k8spacket-helm-chart
plaintext
Install k8spacket:
shell
$ helm install k8spacket --namespace k8spacket k8spacket/k8spacket \
 --create-namespace
plaintext
If you have custom options or values you want to override:
shell
$ helm install k8spacket --namespace k8spacket -f my-k8spacket-values.yaml \
k8spacket/k8spacket
plaintext
Then you can add the Node Graph API plugin and data source to your Grafana instance, you can do it manually or change the helm value of the Grafana Chart, for example:
yaml
grafana:
  env:
    GF_INSTALL_PLUGINS: hamedkarbasi93-nodegraphapi-datasource,marcusolsson-json-datasource
  datasources:
    nodegraphapi-plugin-datasource.yaml:
      apiVersion: 1
      datasources:
        - name: "Node Graph API"
          jsonData:
            url: "http://k8spacket.k8spacket.svc.cluster.local:8080/nodegraph"
          access: "proxy"
          basicAuth: false
          isDefault: false
          readOnly: false
          type: "hamedkarbasi93-nodegraphapi-datasource"
          typeLogoUrl: "public/plugins/hamedkarbasi93-nodegraphapi-datasource/img/logo.svg"
          typeName: "node-graph-plugin"
          orgId: 1
          version: 1
    marcusolsson-json-datasource.yaml:
      apiVersion: 1
      datasources:
        - name: "JSON API"
          url: "http://k8spacket.k8spacket.svc.cluster.local:8080/tlsparser/api/data"
          access: "proxy"
          basicAuth: false
          isDefault: false
          readOnly: false
          type: "marcusolsson-json-datasource"
          typeLogoUrl: "public/plugins/marcusolsson-json-datasource/img/logo.svg"
          typeName: "json-api-plugin"
          orgId: 1
          version: 1
plaintext
Then you can add dashboards configmap to Grafana stack:
sh
$ kubectl -n $GRAFANA_NS apply --recursive -f ./dashboards
plaintext
Usage Demo
connection, bytes, duration
You can set the Graph mode to the following three different types:
- Connection — Established connections
- Bytes — Total bytes that are sent or received by workloads
- Duration — Calculates the lifetime of connections
The following giphy shows three different modes:
Pic from k8spacket
Reference
For more details, please visit the k8spacket Github source code: https://github.com/k8spacket/k8spacket