Collecting and visualizing Kubernetes events using Loki and Kubernetes Event Exporter for effective
\
Prerequisites
The Kubernetes Event Exporter is a powerful tool that solves the problem of missed Kubernetes events. It exports these events to various outputs, improving observability and enabling custom alerts. With this exporter, exporting events to other tools becomes effortless, enhancing event observability, creating custom alerts, and aggregating event data effectively.
In this tutorial, we will use Loki as a log aggregator and Grafana for log visualization. Loki efficiently collects and stores log data, making it perfect for aggregating Kubernetes events. Grafana provides a user-friendly platform to create insightful dashboards and visualizations using the collected log data. By integrating these tools with the Kubernetes Event Exporter, you can achieve comprehensive observability, monitoring, and alerting for your Kubernetes cluster, enabling data-driven decision-making and efficient management of your applications and infrastructure.
In our case, we’ve got Grafana up and running! So, if you’re not familiar with the deployment process, I recommend checking out the documentation for deploying Grafana in a Kubernetes cluster.
Loki Deployment
To begin, we will deploy Loki as a lightweight single binary using Helm. As a first step, let’s create a values file and name it loki-values.yaml. Additionally, it’s important to mention that I have disabled authentication because Grafana cannot establish a connection with authentication enabled. This information was obtained from the following issue: link. Also, I encountered an issue when deploying the Helm chart in single binary mode. The error message “loki-memberlist can’t be resolved” prompted us to add the property “memberlist.service.publishNotReadyAddresses: true” to prevent it. We found the solution in this issue.
```yaml loki: commonConfig: replication_factor: 1 storage: type: ‘filesystem’ auth_enabled: false singleBinary: replicas: 1
persistence: enabled: true accessModes:
- ReadWriteOnce size: 50Gi annotations: {}
memberlist: service: publishNotReadyAddresses: true ```plaintext
To deploy our Helm chart add Grafana’s chart repository to Helm:
plaintext
helm repo add grafana https://grafana.github.io/helm-charts
plaintext
After that we run a command to deploy our Loki, in our case it would be in the “monitoring” namespace. Debug flag I use to make sure that all configuration is perfect
sh
helm install loki grafana/loki -n monitoring -f loki-values.yaml --debug
plaintext
Kubernetes Event Exporter
Once Loki is deployed, we will go ahead to deploy the Kubernetes event exporter. Just like with Loki, we will utilize the Helm chart from this repository, along with our custom values file named values.yaml.
```yaml replicaCount: 1
image: repository: ghcr.io/resmoio/kubernetes-event-exporter pullPolicy: IfNotPresent # Overrides the image tag whose default is the chart appVersion. tag: latest
imagePullSecrets: [] nameOverride: “” fullnameOverride: “”
serviceAccount: # Specifies whether a service account should be created create: true # Annotations to add to the service account annotations: {} # The name of the service account to use. # If not set and create is true, a name is generated using the fullname template name: “”
service: type: ClusterIP port: 2112
Override the deployment namespace
namespaceOverride: “monitoring”
rbac: # If true, create & use RBAC resources create: true
resources: # We usually recommend not to specify default resources and to leave this as a conscious # choice for the user. This also increases chances charts run on environments with little # resources, such as Minikube. If you do want to specify resources, uncomment the following # lines, adjust them as necessary, and remove the curly braces after ‘resources:’. limits: cpu: 100m memory: 128Mi requests: cpu: 100m memory: 128Mi
nodeSelector: kubernetes.io/os: linux
affinity: {} ```plaintext
In addition to this file, you need to include the “config” property, which I will describe below. Within the “config” property, you can specify the destination for the event exporter’s data. In our case, we will use Loki, but you can integrate many other applications as listed in the documentation. Since Loki does not have a direct integration, we will utilize it as a simple webhook, making requests to the Loki API. Furthermore, we will format our request to display comprehensive event data. The receiver is listed as a “dump” to easily access and read the logs via the command line using the command kubectl logs.
yaml
config: |
  logLevel: debug
  logFormat: json
  route:
    routes:
      - match:
        - receiver: "dump"
        - receiver: "loki"
      - drop:
        - namespace: "monitoring"
  receivers:
    - name: "dump"
      stdout: {}
    - name: "loki"
      webhook:
        endpoint: "http://loki.monitoring.svc.cluster.local:3100/loki/api/v1/push"
        headers:
          Content-Type: application/json
          User-Agent: "kube-event-exporter"
        layout:
          streams:
            - stream:
                app: kube-api
                source: event-exporter
                severity: "{{ .Type }}"
                reason: "{{ .Reason }}"
                name: "{{ .InvolvedObject.Name }}"
                namespace: "{{ .InvolvedObject.Namespace }}"
                kind: "{{ .InvolvedObject.Kind }}"
                host: "{{ .Source.Host }}"
                component: "{{ .Source.Component }}"
              values:
                - - "{{ mul .GetTimestampMs 1000000 }}"
                  - "severity={{ .Type }} namespace={{ .InvolvedObject.Namespace }} object={{ .InvolvedObject.Kind }}/{{ .InvolvedObject.Name }} reason={{ .Reason }} message={{ .Message }}"
plaintext
Just like in the Loki deployment, we add the repo:
sh
helm repo add kubernetes-event-exporter https://resmoio.github.io/kubernetes-event-exporter
plaintext
And deploy with our values.yaml file in the “monitoring” namespace:
sh
helm install kubernetes-event-exporter -f values.yaml . -n monitoring --debug
plaintext
Data visualization with Grafana
To conclude, let’s ensure that everything is functioning properly.
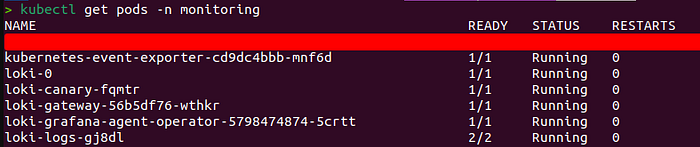
We have successfully deployed Loki and Event Exporter.
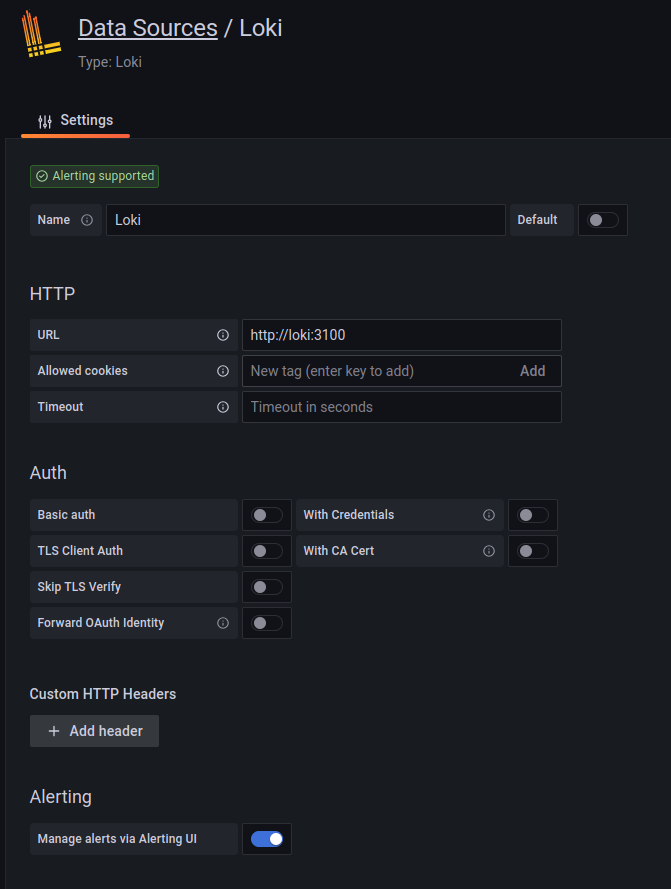
Now, we can conveniently visualize our logs in Grafana. To achieve this, let’s add Loki as a data source in Grafana.
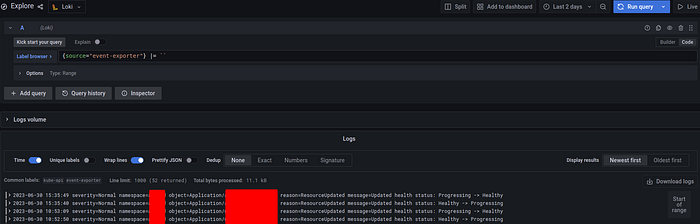
Explore the logs using the query `{source=”event-exporter”} |= ``` to retrieve all logs from the event exporter.
Сonclusion
In conclusion, this tutorial demonstrated the process of collecting Kubernetes events and visualizing them on a Grafana dashboard. By utilizing the Kubernetes Event Exporter and Grafana Loki, event monitoring and visualization were achieved.